 |
Optical Sound Track MethodNOTE: This initial account of methods for transducing images into sound—first posted in 2009—is maintained here for its historical interest. You can also find it archived in Archive.org's Wayback Machine. For current information, please visit griffonage.com. |
1. Rows of Dots1.1—In the fall of 2008, while I was looking for programs to use in paleospectrophony, I stumbled across a freeware program called ImageToSound. The official description at Stopmotion Software runs as follows: Drawing and scratching on the soundtrack area of film to create sound for animation has a long history. StopMotion ImageToSound looks at a .BMP file as though it is part of an optical soundtrack on film, and produces a .WAV file of the sound the image would make. Now you can make these noises without having to use film!
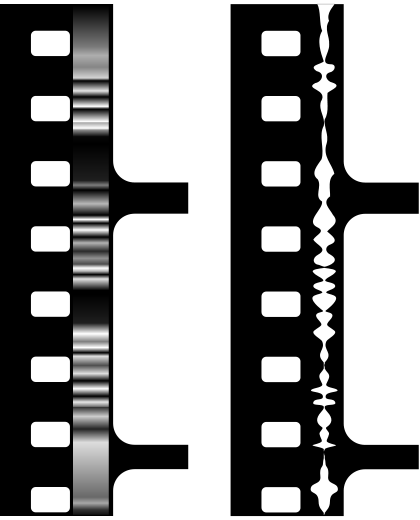
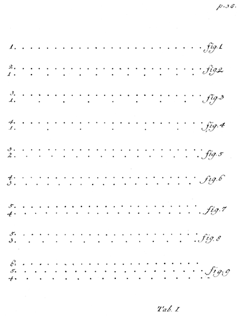
Optical film sound tracks represent changes in amplitude by varying the amount of light that passes through the film—varying either the density (as above on the left) or the width (as on the right). ImageToSound takes digital images in either of these formats and converts them into WAV files. Each row of pixels along the time axis becomes one sample with its value based on the average luminance of the pixels in that row. And it so happens that this same approach enables us to educe a variety of historic inscriptions of sound! 1.2—In 1739, Leonhard Euler included the following plate in his Tentamen Novae Theoriae Musicae, illustrating vibratory ratios between musical intervals:
This type of inscription is easy to educe using ImageToSound. All that's needed is to place each "figure" in a separate image file and to invert from black-on-white to white-on-black. Here's Euler's 1739 illustration, "played" just as though it were an ordinary sound recording: .
|
 |
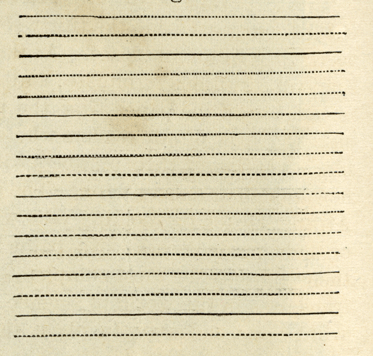
1.3—The first published Edison phonograph recording appeared in the Scientific American of December 22, 1877, with this explanation: In order to exhibit to the reader the writing of the machine which is thus automatically read, we have had a cast of a portion of the indented foil made, and from this the dots and lines in Fig. 2 are printed in of course absolute facsimile, excepting that they are level instead of being raised above or sunk below the surface.
The marks shown here are mainly indentations of varying depth, so at first glance this particular plate may not seem at all "playable." However, the stylus of a tinfoil phonograph can also be understood as creating a trace that varies in width, as shown in engravings made at the time under the microscope (the image below is from Nature, May 23, 1878):
Bearing this in mind, I decided to try running the Scientific American plate through ImageToSound. On September 3, 2008, I made a 2400 dpi scan of the copy in the Wells Library at Indiana University, Bloomington. The image on the page is about 1.65 inches square, with 17 lines. Working from the figures in René Rondeau’s Tinfoil Phonographs, I figured that the dimensions of the original sheet would have been just under 3.375 inches (width of mandrel) by 10.211 inches (the circumference, equal to π times the 3.25 mandrel diameter). Photographs show 34 turns, so the full sheet would have had around 34 lines. The Scientific American image therefore represents halfway across the mandrel—just under 1.6875 inches. So the 1.65 inches of the actual printed image is presumably “real size.” The other “about” 1.65 inch dimension is very close to 1.702, which would be exactly one sixth of the length of the original sheet. I hypothesize that the tinfoil was cut into twelve pieces—one cut parallel to the groove, five cuts perpendicular to it—and that we have a print of one of those twelve pieces. Thus, I've inserted five parts silence to every one part sound. I’ve assembled the pieces starting at the “bottom” and playing lines from left to right—as it would be if the “bottom” were nearer the starting edge of the mandrel. This could easily be the reverse of the correct direction, if the “top” were nearer the starting edge. Or if this is a negative image, or copied from the sheet turned upside-down, the individual snippets might need to be reversed as well. Here are the results, played back at ever-decreasing speeds, starting at approximately two revolutions per second: . Do you hear any hints of a voice here? If so, you may be listening to brief snippets of the first sound recording ever played back for exhibition outside Edison's laboratory. If not—well, it was still interesting to try.
|


